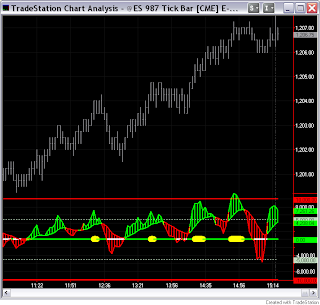
Update 16:11 CT
Finished the first version of the volume oscillator for Sierra Chart. I included the calculation for the standard deviations but I did not add the option of plotting them at this time. Much like the eSignal and NinjaTrader versions the values are different from the values in Tradestion on tick charts. This may be an artifact of the tick charts themselves not having the exact starting points. What I learned - on the oscillator the zero line will not be plotted unless you use allow it in the code. My quick work around was to set the value to 0.000001 and use that. I learned if you set the subgraph value to 0 it does not plot. I guess that matches the boolean logic from the paint bar studies.
Here are screen shots of Tradestation, Sierra Chart, and NinjaTrader versions.


Thanks man you are doing a great job. Keep doing it please!!! I do the same now starting to code custom indicators for sierra chart, but i have no any programming e[perience so that it is very dificult for me to understand how it works, especially what point i'm at now is trying to understand how to work with sierra chart arrays.
ReplyDeleteDid you find out how to fill the indicator like what you have above? Trying to learn this.
ReplyDeleteLet me know thanks.
ReplyDelete